ABSTRACT
A study was conducted to explore the utility of different drinking water temperature, viz. ambient water temperature (10.25±0.28°C, T1), 15–20°C (T2) and 35–40°C (T3) during winter at IVRI, Mukteshwar campus on 18 crossbred (HF × Haryana) lactating cows. They were divided into 3 groups of 6 each and various arameters were studied. At open environment maximum temperature, minimum temperature and mean relative humidity were 11.81±0.45, 1.52±0.27°C and 57.43±2.79%, respectively, the corresponding values for microclimate were 16.61±0.36, 6.68±0.61°C and 86.75±0.55%. Average water intake per cow per day was significantly higher in T3 (40.66±0.55) and compared with cows in T1 (38.63±0.42) and T2 (37.53±0.47). Dry matter intake was more for cows in T3. Daily mean milk yield for the cows in T3 (7.56±0.18 litre) was significantly higher than T1 (6.95±0.16 litre) and T2 (7.06±0.17 litre). Milk SNF, protein and total solids percentages were significantly higher for cows consuming warm drinking water in T2 (15–20°C) and in T3 (35–40°C) than cows consumed ambient cool drinking water. Cows in warm drinking water groups showed relatively more gain in body weight compared to cows provided with ambient cool drinking water. It was concluded that the crossbred cows consuming warm water (35–40°C) performed better than the cows consuming comparatively cold water.
Key words: Altitude, Microclimate, Temperature humidity index, Thermoneutral zone, Water intake
Singh and Chopra (1998) stated that quantity of water intake is highly essential for growth, milk production, reproduction, adaptive potential and feed consumption. It was hypothesized that low water temperature further takes the caloric requirement to warm up to body temperature and very cold water may negatively affect the palatability and eventually water consumption. Therefore, the present study was conducted to explore the use of different drinking water temperature as an important winter management practice in crossbred cows at high altitude temperate Himalayan region.
MATERIALS AND METHODS
The experiment was carried out on 18 farm-bred lactating crossbred cows (Haryana × Holstein Friesian) at
Experimental Cattle Herd, Indian Veterinary Research Institute, Mukteshwar campus. Mukteshwar is geographically situated at 79°382 523 E longitude, 29°282 203 N latitude and 2,286 m above mean sea level on the peak at junction of Gagar and Lohaghat ranges of the Kumaon hills in Nainital district of Uttarakhand, India.The animals selected for the study were divided into 3 groups of 6 each on the basis of milk yield and parity and were allotted to three treatment group, viz. ambient drinking water temperature at 10.25±0.28°C (ambient water, T1), drinking water temperature at 15–20°C (T2) and drinking water temperature at 35–40°C (T3). Drinking water was provided to all the cows in each groups 2 times a day with schedule of 0800 h (after morning milking) and 1600 h (after evening milking). The cows under all the treatments were provided with weighed quantity of concentrate feed individually twice daily as per standards. Daily concentrate requirement was worked out every 7 days based on average milk production during that period. Roughage obtained from
the available resources fed ad lib. to all the cows. Full hand dry milking was done in the shed itself in individual tie up system during 0530 h and 1530 h. Milkers were kept same up to maximum possible extent and sequence of milking was followed daily to avoid the variation in milking interval of each cow. Macroclimatic data collected from weather station of Mukteshwar and microclimatic data were recorded daily inside the shed once in the morning at 0800 h and again in the afternoon at 1500 h. The temperature
humidity Index (THI) was calculated by using equation, THI =0.72 (Tdb +Twb) +40.6 of (McDowell 1972), where Tdb and Twb are dry bulb and wet bulb temperatures respectively in °C. To minimize the day-to-day variationfeed intake was estimated for 2 consecutive days in a week intake of individual cow and DM consumption was calculated on the basis of DM content of roughage and concentrate. Drinking water was provided in buckets twice a day. Total water consumption (direct + through feed), were calculated on moisture % basis of roughages and concentrate and water drunk by animal. Daily milk yield of animals was recorded individually and milk samples were analyzed for fat, solids not fat (SNF), protein, total solids and density
percentages using automatic milk analyzer at weekly interval. Body weight of cow was recorded at the start of the experiment and at the end of the experiment using digital weighing scale. To find the beneficial effect (if any) of warm drinking water at least during extreme cold the experiment was conducted covering the coldest part of the winter. All the experimental animals were housed in tie-barn under double row tail-to-tail shed. One week adjustment period was provided for all the cows to habituate drinking water in bucket and to standardize watering practices. The analysis of variance (ANOVA) of various data collected was done as completely randomized design (CRD) and means were compared by Duncan’s multiple range test (DMRT) using statistical methods as per Snedecor and Cochran (1994).
RESULTS AND DISCUSSION
Macroclimatic and microclimatic variables: The range of maximum temperature, minimum temperature, relative humidity (RH) morning and RH evening recorded was 3.0 to 16.9°C, –2.60 to 6.80°C, 10–100% and 26–100% respectively. The corresponding values inside the animal shed recorded were 9.0–21.0°C, 0 to 14°C, 73–89% and 54–91% respectively. Temperature humidity index (THI) in the morning and evening varied from 52.12–62.92 and 55.72–70.12 respectively. For all these variables microclimatic changes inside the shed was higher than the outside environment and value differ significantly. This indicated that tail-to-tail tie-barn house at high altitude temperate region conserved the heat and humidity. This was due to expired air of animals and evaporation of moisture inside the shed. However optimum productivity of cattle
occur at an air temperature of 13–18°C and RH of 60–70% (McDowell 1972) and lower critical value of THI was 64 (Igno et al. 1992).
Water and feed intake: Ambient drinking water (T1) temperature during the experiment period recorded at the time of offering to the animals at morning as well as at afternoon and the minimum and maximum temperature of water at morning and afternoon ranged from 2.0–12°C and 3.0–17.0°C. However, overall mean of ambient water temperature (10.25±0.28°C) was 3.59°C higher than the outside air temperature. At morning cows under T3 and T2 drank significantly (P<0.01) more water as compared to T1 (Table 1). This might be due to better palatability of warm water than chill ambient water. Conversely, at afternoon water intake was differed significantly (P<0.01) among the treatment groups and cows in T1 drank highest quantity of water (14.67±0.31 litres) followed by T3 (10.08±0.38) and cows in T2 drank lowest quantity of water (6.70±0.40 litre). Higher water intake of cows in T1 at afternoon might be due to rise in water temperature compared to morning, which might have increased the palatability. There was a random fluctuation in amount of water drunk in all the 3 treatments with increase in duration of experimental period. This was possibly due to changes in air temperature,
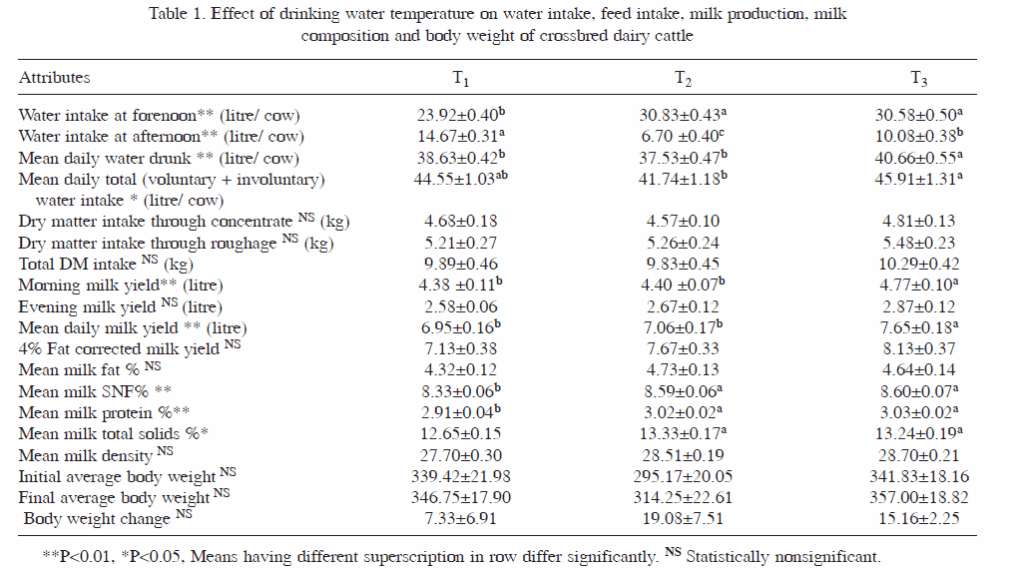
humidity and THI during the experimental period. However, average water intake per cow per day was significantly (P<0.01) higher in T3 (40.66±0.55) and compared to cows in T1 (38.63±0.42) and T2 (37.53±0.47), whereas the latter 2 groups’ water intake was statistically comparable. This indicated that water at 35–45°C was more palatable than 15–20°C and lower drinking water temperature. This observation corroborated with reports of Huuskonen et al. (2011) who observed a linear response of water intake to increase in drinking water temperature from near freezing to about body temperature in Holstein cows. Contrarily, Andersson (1985) observed that cows drank significantly (P<0.01) less amount of 24°C water than that of the water at lower temperatures (3, 10 and 17°C). There were statistically significant differences (P<0.05) of total water intake (voluntary + involuntary) among the treatments. Cows under T3 (45.91±1.35), consumed significantly (P<0.05) more water than T2 (41.71±1.18) whereas water intake of cows under T1 (44.55±1.03 litres) was statistically (P>0.05) comparable with those in T3. The higher water intake of cows in T3 might be due to better palatability of warm water (35–40°C) as there was comparable feed intake among the treatment groups. There were no significant differences among different treatment groups in daily DM intake through concentrates, roughages and total DM intake. However DM intake was relatively more for cows in T3.
This might be because of increased water intake causing increment in the appetite leading to more milk production. These results are consistent with the findings of earlier worker. At ambient temperature below the lower limit of thermoneutal zone sheep consumed less feed, digest their feed less efficiently and convert more energy to heat production (NRC 1989). Milk production and its composition: Mean milk yield
for morning observed that cows under T3 yielded significantly (P<0.01) more milk (4.77±0.10) as compared
to T2 (4.40±0.07) and T1 (4.38±0.11 litres), whereas the latter 2 groups were statistically comparable and the
difference was 0.37 and 0.39 litres higher in T3 group compared to T2 and T1, respectively. However, the
differences in milk yield at afternoon hours among the treatment groups were statically comparable. Daily mean milk yield for the cows in T3 (7.56±0.18 litre) was significantly higher than T1 (6.95±0.16 litre) and T2
(7.06±0.17 litre) whereas the differences between T2 and T1 was statistically comparable and the difference was 0.59 and 0.70 litre higher in T3 group. The higher milk yield of cows in T3 group might be due to warm drinking water (35°–40°C) helped in not only conserving the energy but also enhanced the water intake. The cows in T3 group consumed more feed (11.08 ±0.42 kg DM) than the cows in T2 (10.58 ±0.45 kg DM) and cows in T3 (10.89 ±0.46 kg DM). When animals were subjected to extreme cold stress, substantial dietary energy might be diverted from productive functions to the maintenance of body heat (Koknaroglu et
al. 2005). The change in metabolic intensity with thermal adaption can be expressed as a 0.91% increase in maintenance energy requirement for each degree below 20°C to which cattle have been adapted (NRC 1981).
Johnson (1976) reported that in lactating cows, cold weather and lowered ambient temperatures reduces milk yield. This may be due to the diversion of net energy to the maintenance of body temperature and maintenance than production. Similarly, 4% fat corrected milk (FCM) yield was 1.0 litre and 0.46 litres higher in T3 in comparison to T1 and T2, respectively. This was due to higher milk yield in T3 as compared to T2 and T1 and relatively higher fat percentage in T3 group. The results are in accordance with the previous findings of Osborne et al. (2002). There was no statistically significant difference among the treatment groups for fat
percentage of morning as well as evening milk. This might be due to comparable dry matter consumption through roughage among the treatment groups. However, cows consumed warm drinking water in T2 (15–20°C) and T3 (35–40°C) showed relatively higher milk fat percentage than cows consumed cool ambient water. Thompson et al. (1979) concluded that possibly warm drinking water favoured more acetate production in rumen, which in turn increased milk fat percentage. SNF, protein and total solids percentages of
milk was significantly higher for cows consuming warm drinking water in T2 (15–20°C) and in T3 (35–40°C) than cows consuming ambient cool drinking water, while the difference in SNF percentage among T2 and T3 was statistically comparable. These results corroborated with the findings of Ozrenk and Inci (2008) and Heck et al. (2009) who reported that changes in protein percentage of cows in cold stress. Mean milk density percentage was statistically comparable for cows consuming warm drinking water in T2 (15–20°C) and in T3 (35–40°C) and cows consuming ambient cool drinking water (T1). The body weights of cows in all the 3 treatment groups were randomly positive and negative energy balance. This might be due to the fact that cows were in different days of lactation and individual cow’s milk yield varied. However cows in warm drinking water groups showed relatively more gain in body weight compared to cows provided with ambient cool drinking water. The lower body weight gain in T1 group might be due to requirement of relatively more energy to maintain the normal body temperature. These results are consistent with Demircan et al. (2007) who reported that cattle raised in cold season had lower average daily gain (ADG) than those in warm season (P<0.05). The results of the experiment revealed that tie-barn house of dairy cattle conserved the heat and humidity during winter at high altitude temperate region. Providing warm drinking water (35–40°C) to crossbred lactating dairy cows during winter at high altitude temperate Himalayan hills improved the
acceptance of drinking water as indicated by increased water consumption P<0.05) and increased the average daily milk yield significantly (P<0.05) as compared to cows provided with ambient cold drinking water.
ACKNOWLEDGEMENT
Authors are highly thankful to Director, IVRI for providing all the facilities to carry out this research work at
dairy farm of the Mukteshwar campus.