SUMMARY
Cow cleanliness is important for providing hygienic milk production and the welfare of dairy cows. Body cleanliness scoring was based on subjective evaluating of degree of manure contamination on different areas of the cow’s body. The aim of this study is to evaluate the effects of body cleanliness score on some criteria such as somatic cell count (SCC), pH, conductivity (μS/cm) and color used in the detection of milk quality in dairy cattle. In this respect, Tail Head (TH), Upper Rear Limb (URL), Lower Rear Limb (LRL), Udder Side (US), Ventral Abdomen (VA) and Hind Udder (HU) regions of dairy cows were scored by 5 different assessors according to body cleanliness.
Consistency (α), correlation coefficient (r) and percentage (X%) values between observers evaluated from 5 assessors for body cleanlinessscore were found as 0.910, 0.688 and 0.539, respectively. In addition, the highest body cleanliness rates (%) by scoring regions,2 and 3 scores were observed in the TH, URL and LRL regions. However, in the TH and US regions, it was observed that1, 2 and 3 prevalence of body cleanliness scores are concentrated in this herd. As a result of analysis of variance, although conductivity (P<0.05) and some milk color parameters such as b* (P<0.05) and C* (P=0.053) values were statistically significant in
US region, a* value, which is one of the other color parameters in the HU region, was again found to have higher means in the dirty body cleanliness score group. In other words, when the least squares mean of clean, slightly dirty and dirty animal groups are taken into consideration, it is also observed that other milk quality criteria tend to increase due to the increasing body cleanliness score. These results suggest that a lot more attention should be paid to herd management to ensure hygienic milk production, animal health and welfare in this herd.
INTRODUCTION
Dairy cattle breeders have primarily concentrated in the high milk yield per cow 1. So, dairy breeding programs by selection primarily aim to the improvement of milk yield. However, there are existences of many environmental factors affecting milk production. Taking into account environmental factors are extremely
important to demonstrate the phenotypic values of animals as well. Increasing the income obtained from dairy farms can be achieved with well-planned and sustainable herd management. Both paying attention to the applications contained in the herd management and trying to reach the best practices that allow a farm’s economic strength in a farm should be the target. Especially, practical applications (subjective) in farm help
save from both labour and time. Body condition scoring2, lameness3, teat4 and body cleanliness scores5,6 are given as these applications. These applications are also important to be used on farm as a practical tool for monitoring animal welfare in addition to saving time and labour in farms. Cow cleanliness is important for providing hygienic milk production and the welfare of dairy cows. Body cleanliness scoring was based on subjective evaluating of degree of manure contamination on different areas of the cow’s body. The best indicator to measure the success of manure management in a farm is body cleanliness score of animals. Body cleanliness score is one of the important indicators of animal welfare that varies depending on climatic factors, financial power of farms and animal behaviors.7 The presence of poor hygiene in farm facilitates
more exposure to environmental pathogens of animals, and so this will cause an increase in the cases of mastitis.8 Mastitis is one of the main problems in herds in terms of increased somatic cell count and bacteria in milk that causes significant risk to human health9, reduces the quality of milk and dairy products10 and also leads to loss of milk production.11,12 Similarly, animals must be sufficiently clean for increasing visuality of animals in breeding sales, meat hygiene in animals slaughtered and controlling the quality of leather product.13Hauge et al.14 stated that slaughtered dirty animals result in deductions in payment to farmers in Norwegian abattoirs based on national guidelines.
Depending on the barn structure, especially in seasons with plenty of rainfall, manure management should be paid more attention in farms in case there is a greater risk to pathogens, fallrelated injuries, and foot and udder problems. Also, animals should be periodically followed with regard to manure contamination throughout the year by the same people. There are several basic manure transfer mechanisms such as direct
transfer, leg transfer, splash transfer and tail transfer that cause manure contamination to animals.6 Body regions used in the hygiene scoring are usually tail head, upper rear limb, lower rear limb, udder side, ventral abdomen and hind udder.15 Hygiene scoring charts were proposed by Reneau et al.5 and Cook and Reinemann6 to monitor cow cleanliness in herd management. The aim of this study is to evaluate the effect of body cleanliness score on some criteria such as somatic cell count (SCC), pH, conductivity (μS/cm) and color used in the detection milk quality in Brown Swiss and Holstein Friesian dairy cattle.
MATERIALS AND METHODS
Animals and Data
A total of 167 Brown Swiss and Holstein Friesian cows from the Galipoglu HAY-TAR Agricultural Enterprise were used in this study in Konya Province of Turkey. The farm is located at 38°16’44”N latitude and 32°27’03”E longitude, 1065 m above the sea level and 0.53% slope. Cows were housed in a free- stall barn bedded with rubber carpet on concrete and milked twice daily in a 2 x 9 side-closed milking parlor with two milkers. The
average daily milk yield of the farm was approximately 20 kg/day. Milking procedure such as pre-milking, pre-dipping, post-milking, post-dipping and disinfection of milking implantation is regularly performed between each milking party in parlor. Milk yields of each cow used in this study were obtained from herd management program (DeLaval Alpro, Version 7.00). Dairy cows were separated into different feeding groups according to daily milk yield during lactation.
Sample Collection and Analysis
Farms were visited in August to milk sampling and samples of milk were taken from each cow at the milking by using sampling equipment to represent homogeneous of all milk. Samples of milk were taken into a 50 ml falcon tube and stored at 4–6 °C in a cool box until analyses were made in the laboratory. Analyses were immediately conducted in the laboratory after the end of the morning milking. Somatic cell counts of all samples were then analyzed with the NucleoCounter SCC-100 (Chemometec, Denmark), pH and conductivity (μS/cm) were analyzed two times by an ultrasonic milk analyzer (LACTOSCAN MMC 30 sec Milk Analyzer, Milkotronic Ltd, Bulgaria) and the color characteristics of the samples were measured by the Minolta
Chroma Meter CR-400 (Konica Minolta, Inc., Osaka, Japan). CIELAB system measuring parameters are L, a, b* from the samples. The L(darkness-lightness ranges between 0 and 100), a (green-red ranges between -60 and +60) and b* (blue-yellow ranges between -60 and +60) color values at three times in the milk samples were averaged and recorded. Hueo (rednessyellowness) and Chroma (vividness-dullness) values were calculated
using the formula Hueo = Tan-1 x (b/a) and Chroma = a2 + b2
Body Cleanliness Scoring
For body cleanliness scoring, animals were photographed on milk sampling day and the day before in right, left and back body regions. By using hygiene scoring charts5,6 such as tail head, upper rear limb, lower rear limb, udder side, ventral abdomen and hind udder, animals captured photos were evaluated individually
regarding body cleanliness scores by 5 different assessors in the computer considering the dirtiest side of the body. In fact, the body cleanliness score was evaluated from the dirtier side of the animals because the anure contamination was not the same on either side.
Statistical analysis
In this study, the Cronbach’s alpha statistic was used for consistency of the body cleanliness score between two observers taking into account all the scores as well as all observers. Consistency analysis was carried out with the SPSS 18.0 for Windows. 16 After consistency of the body cleanliness score, scores were categorized as clean, slightly dirty and dirty considering all the scores. For analysis, clean, slightly dirty and dirty scores
were defined as <2, 2≤ and <4, 4 and 5≤ except hind udder, respectively. For hind udder, clean, slightly dirty and dirty scores were defined as <2, 2≤ and <3, 3≤, respectively.
SCC values were transformed into somatic cell linear scores (SCLS) to get a normal distribution by applying the following equation17;
SCLS = [log2 (SCC/100,000)] +3.
Following these, the JUMP statistical software package program18 was used to determine the associations between body cleanliness scores and the traits. The following statistical model was applied;
Yijklm = μ + ai +bj + ck + bxijkl + eijklm
Where;
Yijklm: observed traits [TDMYm, logSCC (cell/ml), pH, conductivity (uS/cm) and color] in ijk-th animal
μ: mean,
ai: i. effect of parity, i = 1, 2, 3, 4, 5≤
bj: j. effect of body cleanliness scores, j= clean, slightly dirty and dirty score
ck: k. effect of calving season, k= winter (December, January and February), spring (March, April and May), summer (June, July and August) and autumn (September, October and November)
bxijkl: partial regression coefficient of days in milk (DIM) and test day milk yield in the morning milking (TDMYm) for observed traits
eijklm: random error effect
Since there was no difference in body cleanliness scores in terms of the milk quality criteria, the breed factor was removed from the statistical model. After statistical analyses, the differences between any two least squares means of the body cleanliness scores were compared with Tukey HSD test for traits by using JUMP statistical software.
RESULTS AND DISCUSSION
Consistency, correlation coefficient and percentage values between assessors
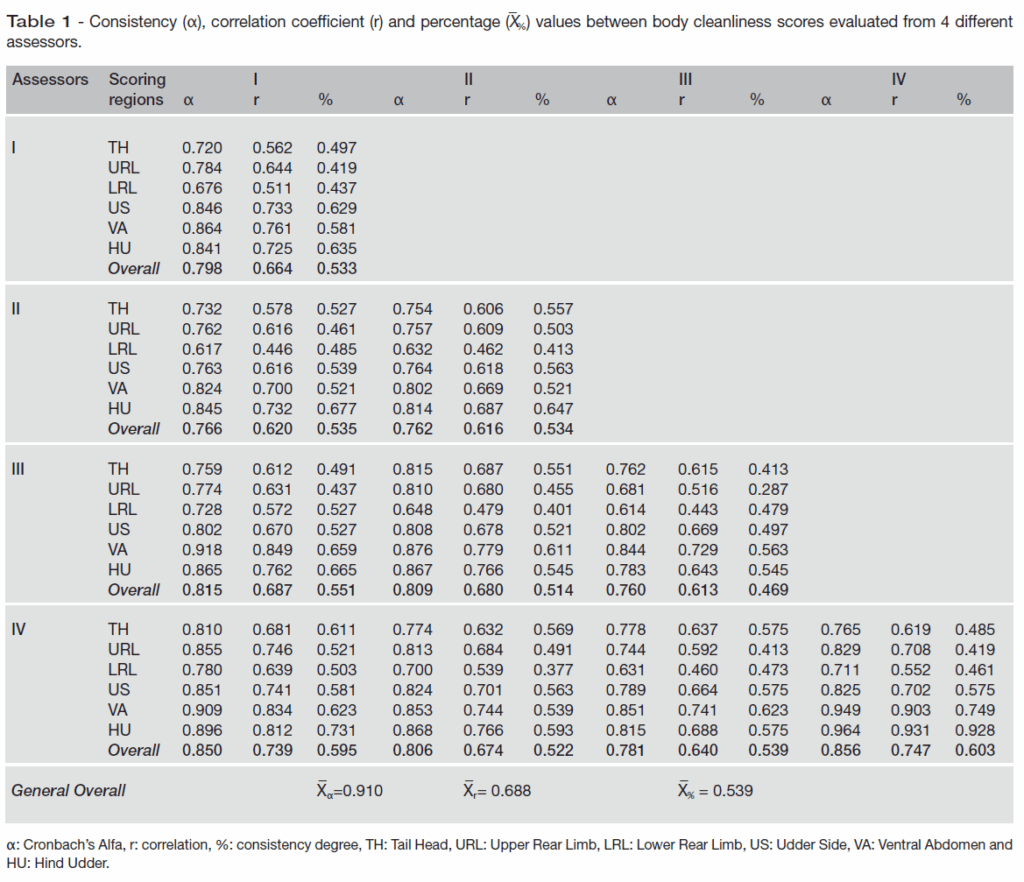
Cattles were assessed and scored according to body cleanliness. Then, consistency between body cleanliness scores was evaluated from 5 different assessors. So, five assessors were taken into consideration for compliance in the analysis (P<0.01). Consistency (α), correlation coefficient (r) and percentage (X%) values
between body cleanliness scores evaluated from 5 different assessors are given in Table 1. As can be seen in Table 1, there is a high degree of consistency (α ≥0.760) between two assessors as well as all assessors
(0.910). Considering the compatibility between assessors, the highest consistency was found between IV and V assessors (0.856). However, the lowest consistency was found between III and IV assessors (0.760). As can be seen in Schreiner and Ruegg8 study in terms of agreement within observer and between duplicate score, consistency values in current study seems to have a higher values than their study (ranges between 0.25 and 0.88) by using Kappa analysis. This situation was similar to the results of Schreiner and Ruegg8 study. correspondingly, Reneau et al.5 stated that mean correlation coefficients for hygiene scores assigned twice by 4 experienced assessors were ≥0.884, indicating high repeatability. In this study, mean correlation oefficients
(for hygiene scores by 5 assessors) were found as 0.688 and between ≥0.613. As far as mean percantage (X%) is concerned, values were found as 0.539, indicating acceptable rate.
Body cleanliness rates via scoring regions (%)
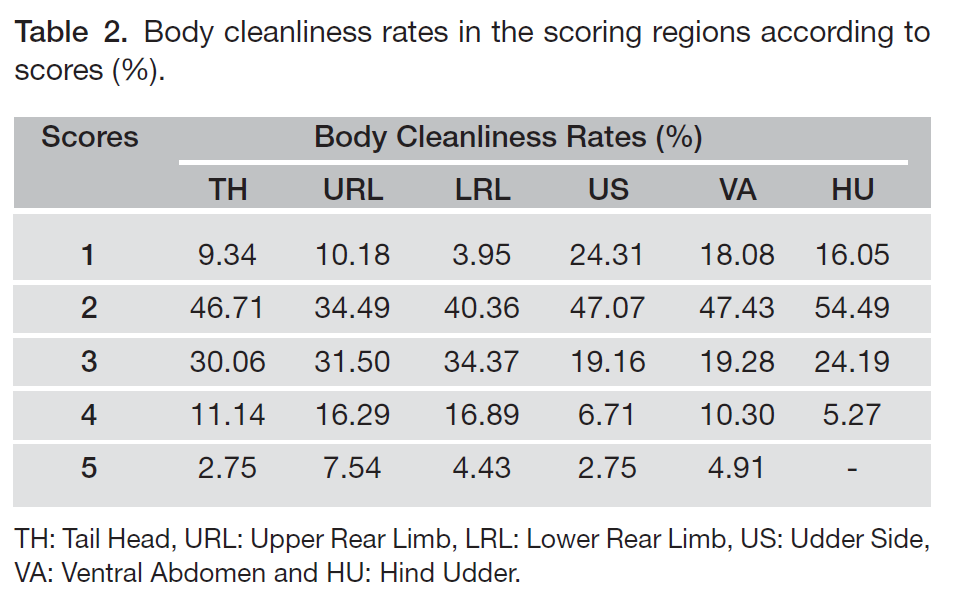
Body cleanliness rates in the scoring regions according to scores are given in Table 2
According to Table 2, the highest body cleanliness rates (%) by scoring regions, 2 and 3 scores were observed in the TH, URL and LRL regions. However, it is observed that 1, 2 and 3 body cleanliness scores are concentrated in the TH and US regions in this herd. Neja et al.19 stated that over 33% of the cows were
found to be clean, with more of them in the free-stall barn, and also analysis of the cleanliness of body parts showed that the highest hygiene level was characteristic of the udders and underbelly (scores of 1 for 47% and 56% of the cows, respectively). Different herd management systems affect animal health and welfare. Considering the literature about the body cleanliness studies, body cleanliness rates also vary depending on some factors such as shelter types (closed-open), stall structures (free bound), bearing materials (sand-handle-rubber), mechanization structures, the season when scoring and even animal behaviors in dairy cattle farms.
Effect of body cleanliness score on some milk quality criteria
Although milk is an indispensable source of protein for human nutrition, it plays a critical role in the early life of living being. Therefore, milk quality is important for both health and welfare. Milk with a mastitis is unsuitable for human consumption and health. So, it is extremely important to produce healthy milk
from healthy cows. The somatic cell count (SCC), pH, conductivity and milk color are commonly used as a measure of udder health and milk quality.23 In recent years, one or more of these milk quality traits are especially evaluated together to produce healthier milk in dairy cattle.24 In this respect, cow cleanliness
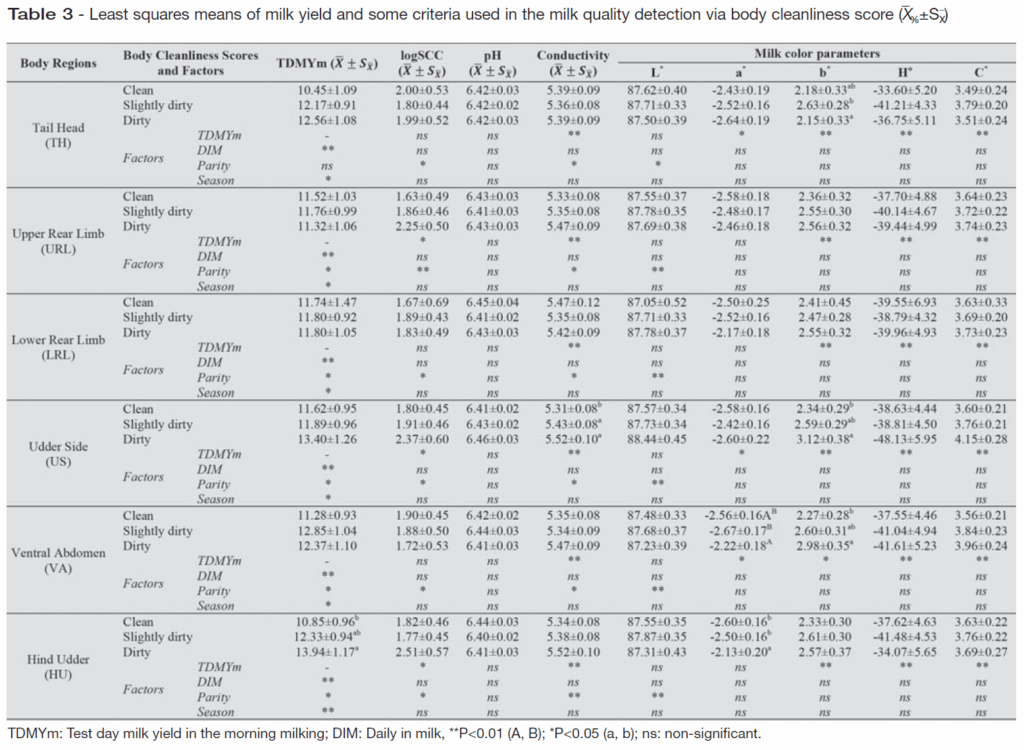
is also an indicator of udder health and welfare of dairy cows. In this study, least squares means of milk yield and some criteria used in the detection milk quality via body cleanliness score are given in Table 3.
According to results, body cleanliness scores for tail head, upper rear limb, lower rear limb, ventral abdomen and hind udder were not associated with pH and conductivity (P>0.05). However, conductivity values in udder side of clean, slightly dirty and dirty cows were found as 5.31±0.08, 5.43±0.08 and
5.52±0.10, respectively (P<0.05). As in the conductivity value, b* parameter of milk color were found as 2.34±0.29, 2.59±0.29 and 3.12±0.38, respectively (P<0.05). The same trend exists in the tail head region. b* parameter values in tail head of clean, slightly dirty and dirty cows were found as 2.18±0.33, 2.63±0.28
and 2.15±0.33, respectively. For udder side with regard to chroma values (C), it is said that dirty cows have more saturated milk with 4.15 value, while in the clean cows with 3.60 appears duller. Also, slightly dirty cows with 3.76 value have a value between both (P=0.053). In addition, dirtier cows in the hind udder region have higher a parameter of milk color. a* parameter values in the hind udder regions of clean, slightly dirty and dirty cows were found as-2.60±0.16, -2.50±0.16 and -2.13±0.20, respectively. Based on this study result, although there is statistically no difference in milk yield, statistical differences were found between some important milk quality characteristics in some regions according to body cleanliness.
Schreiner and Ruegg reported that the mean of udder hygiene scores was 22%, and they also stated that there was a significant relationship between individual cow linear score increasing with poor udder hygiene (especially scores 3 and 4) and environmental pathogen and the prevalence of intramammary infection
(P<0.05). In their study made with udder hygiene scoring system on 1250 cows in 8 herds, researchers reported that cows with udder hygiene scores 3 and 4 were infected with 1.5 times more pathogens than cows with udder hygiene scores 1 or 2. However, in their studies, there was a weak relationship between
rear limb contamination score and pathogens isolated from the udder (P>0.05). In the study conducted to analyze the effect of the housing system (tie-stall vs free-stall) on cow cleanliness, and the effect of
the degree of cow dirtiness on the milk somatic cell count, Neja et al.19 stated that the degree of udder dirtiness created differences (P≤0.01) in the natural logSCC and the natural logSCC increased from 11.54 to 12.37 on average with increased dirtiness of the udder. Also, researchers expressed that greater differences
in the cytological quality of milk were found in cows housed in the free-stall system and stated that when analyzing the effect of overall dirtiness of the cows and the body parts on the percentage of SCC classes, it was found that highest quality milk (< 200 000 cells/ml) was produced by clean cows (71.52%). In the current study, although there was no statistically relationship between logSCC and cow cleanliness, it was found that dirty cows had higher logSCC averages in the other regions except TH and VA.
Some dairy farmers claim that tail docking keeps the udder cleaner, and therefore improves milk quality and decreases somatic cell count.25 In this study, considering the least squares means of the TH region in terms of some criteria used in the milk quality detection, there were no statistical differences in terms of body
cleanliness. However, cows with dirty tails may have also caused dirtiness by contaminating other body parts with tail movements.
In a study by Kimeli et al.26 on 234 dairy cows to determine animal-and farm-level factors associated with upper hind leg cleanliness in smallholder dairy cows, it was reported that the prevalence of soiled legs was 59.0% (137/234). As a result, researchers suggest that farmers should address both housing design (especially the roof and stall size) and management issues (especially stall cleanliness) to enhance leg cleanliness and animal welfare.
CONCLUSIONS
As a result of analysis of variance in regions where body cleanliness scores is evaluated by five assessors, although conductivity (P <0.05) and some milk color parameters such as b * (P <0.05) and C * (P = 0.053) values are statistically significant in US region, a* value, which is one of the other color parameters in the
HU region, was again found to have higher means in the dirty body cleanliness score group.
When the least squares averages of clean, slightly dirty and dirty animal groups are taken into consideration, in other words, it is also observed that other milk quality criteria tend to increase due to the increasing body cleanliness score. However, paying attention to important rules in the herd management such as milking and hygiene may also have caused the lack of significant relationships between the body cleanliness score and some milk quality criteria in this herd.
According to dairy cattle managements, it is desirable that 80% of cows have 1 body cleanliness score in a dairy cattle herd. If more than 10% of dairy cows have 4 body cleanliness score, hygiene measures must be taken urgently because the cows with a body cleanliness score of 3, 4 and 5 have an increased risk of mastitis.5 However, given body cleanliness rates in the scoring regions in this study, manure and milking management, and grooming practices should be revised to prevent the increase of mastitis cases at this herd.